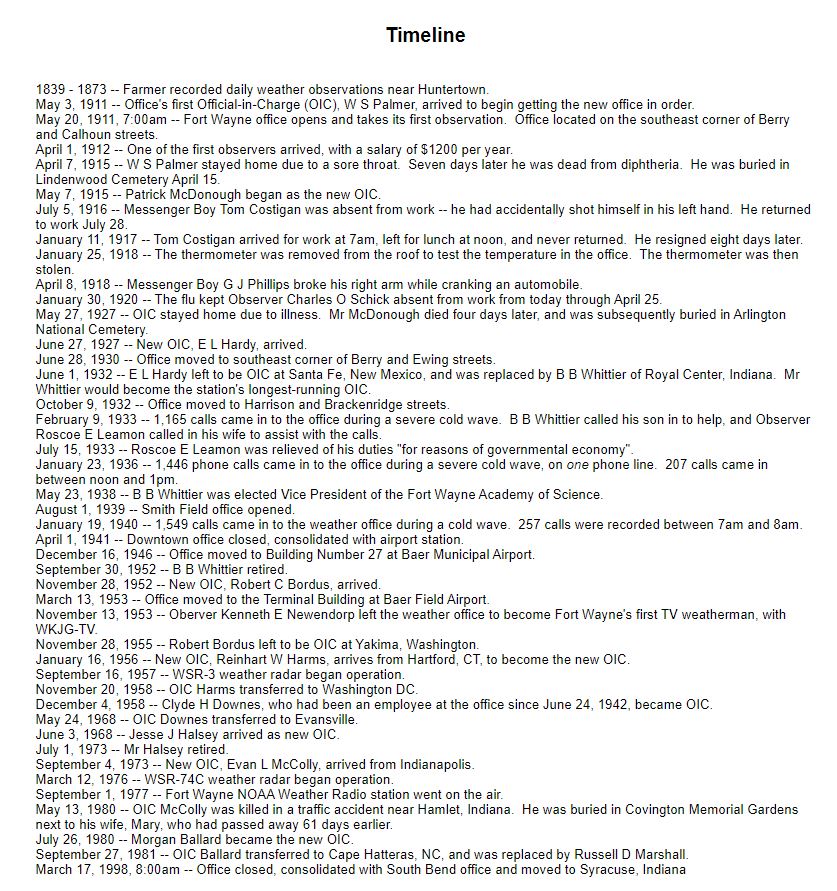
Weather Observing History at Fort Wayne A first-order Weather Bureau Office was established at Fort Wayne in May 1911 at the southeast corner of Berry and Calhoun streets (then known as the Shoaff Building). The first weather observation was taken at 7 a.m. on May 20 from the roof of the nine story building.
The office was moved on June 28, 1930 to the southeast corner of Berry and Ewing streets in the Wayne-Pharmacal Building, where observations were again taken on the roof.
On October 9, 1932 the office moved to the southwest wing of the third floor of the Federal Building at Harrison and Brackenridge streets with observations taken on the roof. A building on the other side of Harrison Street tended to cause some eddy effects with the wind.
An airport station was established at the Smith-Baer Municipal Airport (as it was then called) August 1, 1939. The downtown office continued to operate until April 1, 1941 when the two were consolidated at the airport, in the Administration Building. Observations were taken from the ground, except wind readings were still taken from the roof. Eddy effects were felt here too due to an area of woods to the east of the airfield.
The office made it final move on March 13, 1953, to the second floor of the Terminal Building at Baer Field Airport. It would remain there, in the same set of three rooms, for the next 45 years until the office closed March 17, 1998.
Temperature and precipitation records for Fort Wayne are unofficial for dates prior to May 1911. Records from May 1911 to present are considered official and are recognized as such by the National Climatic Data Center in Asheville, North Carolina.
2024 will be remembered for not only being the warmest year on record, but also for a notable lack of snowfall. Fort Wayne and South Bend both saw a top 10 least snowiest year on record. Temperatures ranged from the single digits below zero to the low 90s throughout the year.
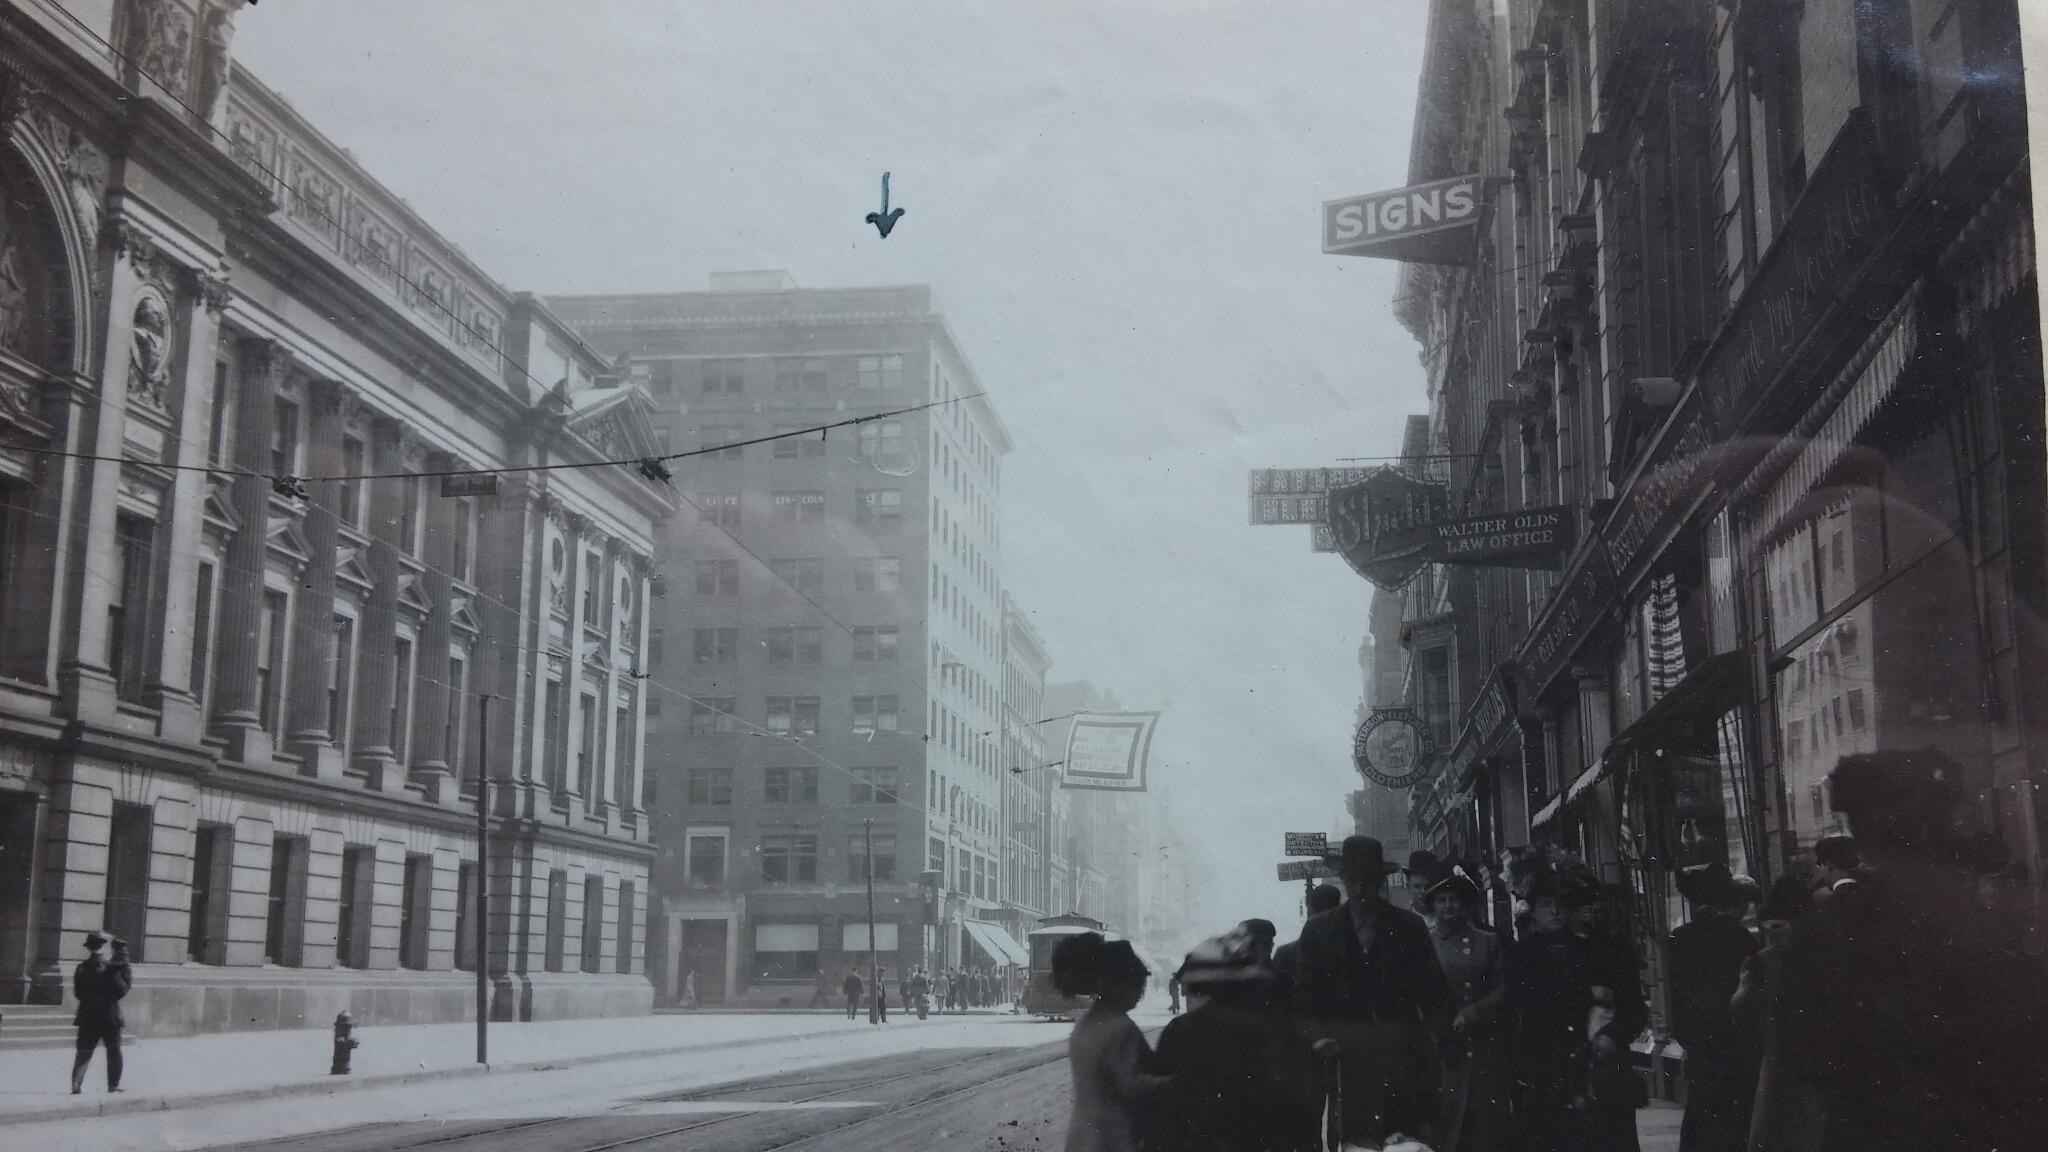
At 7:00 AM on Saturday, May 20th, 1911, the first official weather observation in Fort Wayne’s history was taken on the southeast corner of Berry and Calhoun Streets. It was taken on the roof of the nine story Shoaff Building and telegraphed to Washington, D.C. It was here where a first-order United States Weather Bureau Office had been established and began operations by taking this observation. The Weather Bureau would eventually be renamed to the National Weather Service in 1970. Copied from On this date in 1911: The first official Fort Wayne weather observation by Nathan Gidley published May 20, 2022 and posted May 20, 2022 on Facebook by CBS WANE-TV NewsChannel 15.
1918, January 12 - twenty-four degrees below zero is the lowest recorded temperature in Fort Wayne. From Fort Wayne Indiana Climate at the National Weather Service Weather.gov. Storms and cold caused four days of “unprecedented suffering,” according to The News-Sentinel, and it could have been worse if the city's fuel supplies hadn't been replenished by the arrival of 20 rail cars of coal on the morning of Jan. 16. Copied from The cold old days published February 2, 2019 in The Journal Gazette newspaper.
1924, December 25 - Christmas - the coldest Christmas in the city since records were kept, There was snow on the ground and the story said the previous day's temperature dipped to -11, making it the coldest day in the city since Dec. 21, 1901, which saw temperatures of -14. (National Weather Service records show the coldest Christmas is now 2004, which reached -15; the warmest was in 1982 with a high of 47. Today's forecast [December 25, 2024] calls for a high of 39.)Dec. 25, 1924: Record-setting cold Christmas in Fort Wayne 100 years ago still festive Corey McMaken The Journal Gazette newspaper.
1924, December 29 newspaper articles claim a record cold in the local history for the past twenty-three years (1901), yet the Weather Bureau says the record cold was January 12, 1918 just six years earlier?
Our most recent day with a high of 106° happened 10 years ago. There are 3 other 106° days in #FortWayne's record books and it's the highest temp ever recorded in the city. The Live Doppler 15 Fury Storm Team says we're heating up to the 90s soon and won't get as high as the triple digits.
1936, July 14 - Indiana experienced the highest recorded temperature in the state's history when thermometers hit 116 degrees in Collegeville, Jasper County. Fort Wayne recorded 104°.
On July 14, 1936, Indiana experienced the highest recorded temperature in the state's history when thermometers hit 116...
On July 14, 1936, Indiana experienced the highest recorded temperature in the state's history when thermometers hit 116 degrees in Collegeville, Jasper County.
The United Press reported: "Relief from one of the most severe droughts in the history of the state . . . The scorching heat wave will leave in its wake a state death toll of at least 173 lives. Thousands of dollars of damage has been done to crops, and additional damage has been caused by fires, started by the intense heat. Fifty-seven deaths, including nine in Indianapolis, were reported in the state yesterday. The blistering heat took hold on the state July 4 and for the last eight days the temperature has soared above 100 degrees, establishing a record for Indiana. City dwellers and rural folk suffered alike in the heat."
#OTD in 1936, Indiana experienced the highest recorded temperature in the state's history when thermometers hit 116 degrees in Collegeville.
The United Press reported: "Relief from one of the most severe droughts in the history of the state . . . The scorching heat wave will leave in its wake a state death toll of at least 173 lives. Thousands of dollars of damage has been done to crops, and additional damage has been caused by fires, started by the intense heat. Fifty-seven deaths, including nine in Indianapolis, were reported in the state yesterday. The blistering heat took hold on the state July 4 and for the last eight days the temperature has soared above 100 degrees, establishing a record for Indiana. City dwellers and rural folk suffered alike in the heat."
Think it felt too cold outside to be the first day of spring? Well you'd be right because today will go down as one of the top 5 coldest spring equinoxes on record at Fort Wayne and South Bend! Check it out!
Think it felt too cold outside to be the first day of spring? Well you'd be right because today will go down as one of the top 5 coldest spring equinoxes on record at Fort Wayne and South Bend! Check it out!
Did you know that according to the US National Weather Service Northern Indiana, on this date in weather history in 1942, Fort Wayne's earliest snowfall occurred when a few flurries fell. A trace of snow fell again on the 27th, and these remain the only two September snowfalls on record at Fort Wayne. It was South Bend's earliest snowfall as well, with 0.2" recorded.
All time wettest month on record at Fort Wayne...11.98 inches recorded this June. Previous record wettest month was...
All time wettest month on record at Fort Wayne...11.98 inches recorded this June. Previous record wettest month was 11.00 inches set in July 1986. Previous all time wettest June record has been smashed...8.55 inches set in 2000. The 30 year normal amount for June is 4.16 inches.
Holy corn sweat! That's right. In tonight's weather broadcast, I discussed "evapotranspiration" (or evapotransportation if you get tongue tied like me) and why cornfields are at least partially to blame for our humid summer days.
That's right. In tonight's weather broadcast, I discussed "evapotranspiration" (or evapotransportation if you get tongue tied like me) and why cornfields are at least partially to blame for our humid summer days
📣In Case You Missed It:📣 After much anticipation, NOAA National Centers for Environmental Information and NOAA have re...
In Case You Missed It: After much anticipation, NOAA National Centers for Environmental Information and NOAA have re leased the new U.S. Climate Normals for 1991–2020. This important update helps us explain how current weather conditions measure up to the recent past. Normals provide information about national and localized average temperature and precipitation as well as snowfall, heating/cooling degree days, frost/ freeze dates, growing degree days, and more. Read the full story: Decadal update from NCEI gives forecasters and public latest averages for 1991–2020
Check out the highest wind reports from the last 24 hours! Fort Wayne International Airport set a new record high wind gust of 98 mph, beating the old record of 91 mph, which was set back on June 30, 2012.
Thomas Jefferson, the lead author of the Declaration of Independence, was also an avid weather observer. Here is part of his log from July 1776 in Philadelphia. The late 18th century was during a climate period known as "The Little Ice Age" and a notable coolness is observed here compared to what we expect almost 250 years later. Courtesy of https://jefferson-weather-records.org/
What's in a record? When you hear or see news that a region had its hottest or wettest month since records began, you...
What's in a record? When you hear or see news that a region had its hottest or wettest month since records began, you can check the climatological record books yourself to see what that really means.
Need climate data fast? Climate data, including past weather conditions and long-term averages, for specific observing stations around the United States is only a few clicks away from the nation’s 122 Weather Forecast Offices. Go to http://w2.weather.gov/climate/ and click on your city for climate data! #backtoschool
Here's a look at earliest, latest, and average dates for the first 32F fall freeze. Many locations in our area see the first fall freeze on October 13th. While lows won't drop quite to freezing, patchy frost is possible Wednesday morning. #fall#frost#freeze
It appears likely that the coldest air of the season is on the way early next week! Our current forecast for Halloween...
It appears likely that the coldest air of the season is on the way early next week! Our current forecast for Halloween would place in the top 5 coldest Halloweens on record in Fort Wayne and South Bend if it verifies. The record coldest high temperature on Halloween is 35 degrees, set back in 1917.
On NOAA Satellite and Information Service's GOES-East, some mid to high level clouds are moving west to east across the forecast area. Get outside and enjoy the sunshine today! Clouds move in this evening in advance of the next weather system set to bring widespread rain Friday morning.
(Fun fact: You can also see in this satellite loop where snow still remains on the ground in southern Lower Michigan and far northeast Indiana!)
2023 will be remembered for being much warmer than normal (especially during the winter) and for a notable lack of...
2023 will be remembered for being much warmer than normal (especially during the winter) and for a notable lack of snowfall. Temperatures ranged from the single digits to the low 90s throughout the year. Fort Wayne and South Bend both saw a top 10 least snowiest year on record.
Since it is a quiet weather day, we thought we would share some fun facts about our office! - We don't just forecast...
Since it is a quiet weather day, we thought we would share some fun facts about our office!
- We don't just forecast for northern Indiana! We cover 37 counties, including 24 in northern Indiana, 5 in southwest Lower Michigan, and 8 in northwest Ohio. (see the County Warning Area map below)
- Our office covers 15,875 square miles with a population of ~2.1 million people. The two biggest population centers we forecast for are South Bend, IN and Fort Wayne, IN.
- NWS Northern Indiana opened at our current location in Syracuse, IN on March 17, 1998 after having previously been located at two separate offices in South Bend, IN and Fort Wayne, IN.
- On staff, we currently have 6 meteorologists and 5 lead meteorologists. Our 11 meteorologists work rotating shifts (days, evenings, and overnights) to forecast the weather 24/7 and keep you safe!
- In admin and management, we have an Administrative Assistant (ASA), an Observation Program Leader (OPL), a Warning Coordination Meteorologist (WCM), a Electronic Systems Analyst (ESA), an Information Technology Officer (ITO), and 2 Electronic Technicians (ETs).
- Four pairs of counties have the same name in different states within our forecast area: Saint Joseph IN and MI, Cass IN and MI, Allen IN and OH, and Fulton IN and OH. Makes for fun forecasting when we have multiple sets of counties with the same name!
- Our counties closest to Lake Michigan can receive 80-100+ inches of snow per year thanks to lake effect snow!
Here's a look back at the daily average temperatures and precipitation during winter in Fort Wayne. and South Bend.
As expected, winter 2023-2024 was very warm, especially in December and February for Fort Wayne. There is a noticeable week of below normal temperatures in mid January, but the rest of the winter was relatively warm. December and February were dry winter months for Fort Wayne, while January had a better balance between dry and wet days. 68% of days this winter had measurable precipitation, but only 1 day of the entire winter had over an inch of precipitation (January 9th).
In South Bend, temperatures were quite similar to Fort Wayne, with mid January notably colder than the rest of the winter. Precipitation was above average for December and January, with a pattern change bringing drier conditions for much of February.
For both sites, January 9th was the wettest day of the winter and was also the only day with an inch or more of precipitation. As for temperatures, 1 out of 3 days this winter was 10° (or more) above average!
2024 spring cover photo! Credits to IWN Storm Hunter Adam Davis
While the National Weather Service encourages taking actual measurements of hail size with a ruler or measuring tape, you can also report hail sizes using the common objects in the chart below. Severe hail is classified as hail that is 1" in diameter or larger. #WeatherReady#Hail#SeverePrep
Did you know that our forecast area borders 6 other NWS offices? It may not be a bad idea to follow surrounding offices...
Did you know that our forecast area borders 6 other NWS offices? It may not be a bad idea to follow surrounding offices (especially if you live near any of our CWA borders) in order to get the most up-to-date, timely information when hazardous weather occurs. #SeverePrep
Did you know there are different types of tornadoes? 🌪️ Supercell tornadoes, landspouts, and waterspouts have all...
Did you know there are different types of tornadoes? Supercell tornadoes, landspouts, and waterspouts have all occurred in our forecast area. Click on this image to expand the infographic and learn more! #SeverePrep#Tornado#Landspout#Waterspout
Take a walk outside and smell the... petrichor?! Have you ever experienced the fresh, earthy smell of the outdoors...
Have you ever experienced the fresh, earthy smell of the outdoors after it rains? There's a word for that: petrichor!
This aroma is created when rainfall lands on and disturbs dry soil, releasing organic chemicals, like geosmin, into the air. The human nose is exceptionally attuned to extremely small concentrations of geosmin, as low as 400 parts per trillion! Scientists aren't completely sure why this is, but this ability is thought to have played a role in the survival of early humans by bringing them closer to areas with fresh rain water. #NationalTakeAWalkInAParkDay
As we approach the #Eclipse2024, you’ll likely see cloud cover forecasts for April 8th. Check out this graphic that explains sky conditions!
The City of Fort Wayne’s Community Development Division has been selected to lead a campaign mapping heat and air quality in Fort Wayne. The division will work with community scientists to give residents a stronger voice in the planning and implementation of climate change-preparedness strategies. Fort Wayne and Bloomington are two of 14 U.S. communities selected to participate in the 2024 NOAA Urban Heat Island (UHI) mapping campaign.
This summer, the National Oceanic and Atmospheric Administration’s (NOAA), in partnership with the U.S. Departments of Health and Human Services (HHS) and Housing and Urban Development (HUD), and community scientists will map the hottest neighborhoods in 14 U.S. communities and 4 international cities. Identifying these areas, called urban heat islands, helps communities take action to reduce the health impacts of extreme heat and provides cooling relief for those living in the hottest areas.
Good morning! We're excited to announce that Fort Wayne, IN will be part of a global urban heat island mapping project...
Good morning! We're excited to announce that Fort Wayne, IN will be part of a global urban heat island mapping project this summer! NOAA will, in partnership with The National Integrated Heat Health Information System (NIHHIS) and CAPA Strategies LLC, map heat inequities in 14 US cities and 4 international cities! This annual project is in its 8th year of mapping urban heat islands across the US and internationally. The goal is to find out what areas in each city are the hottest and find solutions to provide cooling relief.
With no rain chances in store until May, it's official! In 127 years of records, April 2024 will go down as the wettest April in Fort Wayne's history! 7.39" of rain has been recorded this month, which is double the average monthly rainfall! There were 2 days in April with over 1" ofrain!
When do highs in the 70s and 80s become more common? Here's a look at earliest, latest, and average dates. South Bend’s...
When do highs in the 70s and 80s become more common? Here's a look at earliest, latest, and average dates. South Bend’s first 70+ day was February 27th and Fort Wayne’s was yesterday (March 4), which is about 3-4 weeks ahead of the normal first 70+ degree day.
ICYMI: Fort Wayne had the wettest April in 127 years of records as 7.39” of rain fell. April 2024 is the wettest month since 7.77” of rain fell in August 2018!
ICYMI: Fort Wayne had the wettest April in 127 years of records as 7.39” of rain fell. April 2024 is the wettest month since 7.77” of rain fell in August 2018!
Happy start to meteorological summer! Do you know the difference between meteorological and astronomical seasons?❄️🌸🌤️🍁 Learn more at https://www.ncei.noaa.gov/news/meteorological-versus-astronomical-seasons.
Happy start to meteorological summer! Do you know the difference between meteorological and astronomical seasons? Learn more at Meteorological Versus Astronomical Seasons.
June 19th marks the 3rd consecutive day of record to near record warm lows in the low to mid 70s across the area! Fort...
June 19th marks the 3rd consecutive day of record to near record warm lows in the low to mid 70s across the area! Fort Wayne and South Bend both set new record warm lows yesterday, with 76° and 75° respectively.
At 4:50pm EDT, Earth's northern hemisphere will be tilted the most towards the sun all year. Today has the longest...
At 4:50pm EDT, Earth's northern hemisphere will be tilted the most towards the sun all year. Today has the longest daylight duration of the year and is the official start of Summer...for most!
Good morning! Ever wondered when and how often it reaches 100° or higher in our area? We did the math so that you don't have to! (Let's be real, who wants to do math at 8 AM anyway?!) Check out these graphics to learn about the history of 100°+ temps in Fort Wayne and South Bend! #100degrees#summer
Not only have there been 4 consecutive nights of new record warm low temperatures set in Fort Wayne, but the last time...
Not only have there been 4 consecutive nights of new record warm low temperatures set in Fort Wayne, but the last time this happened was 88 years ago! This has been a record breaking heatwave in terms of the low temperatures, which has made it difficult to cool off at night and it has only added to the heat of the following day. Unfortunately, we will NOT break the record warm low for June 21st as the low reached 69 degrees this morning (the record warm low for June 21st is 72 degrees, set in 1988) so this streak will come to an end.
JUNE 2024 HEATWAVE RECAP: We made it through 6 days of high heat and humidity! This heatwave was unique in that it was...
JUNE 2024 HEATWAVE RECAP: We made it through 6 days of high heat and humidity! This heatwave was unique in that it was early in the summer and for a long duration. Lack of relief at night was notable, as South Bend and Fort Wayne both set 4 new record warm low temperatures!
Temperatures ≥ 80° are very rare for the end of October. We're forecasting record highs in the low 80s over the next 2...
Temperatures ≥ 80° are very rare for the end of October. We're forecasting record highs in the low 80s over the next 2 days. In fact, Fort Wayne and South Bend are going to come very close to the all-time latest 80°+ days in the calendar year! If you’re a fan of summer weather, enjoy these high temperatures that are 20 degrees above normal! (Many of us here at IWX are hoping for cooler temperatures and a return to fall weather soon!)
**There is a typo on this image. The latest 80+ degree day in South Bend is November 1st, 1950, not October 31st**
WALKING ON SUNSHINE: In October, Fort Wayne normally averages about 37% sunshine throughout the month. Did you notice...
WALKING ON SUNSHINE: In October, Fort Wayne normally averages about 37% sunshine throughout the month. Did you notice this October had a LOT more sun than usual? This year was the sunniest October on record with 63% sunshine thanks to a number of dry days under high pressure.
Just one day after tying the all-time record warm low, Fort Wayne set a record warm low for the month of November on...
Just one day after tying the all-time record warm low, Fort Wayne set a record warm low for the month of November on Tuesday! Before November 5th, 2024, there had never been a low temperature warmer than 62 in Fort Wayne. The old all-time record was previously set on November 3, 2024 and November 27, 1990.
With the arctic air settling in tomorrow (January 20), I was curious what the coldest wind chill on record is for Fort...
With the arctic air settling in tomorrow (January 20), I was curious what the coldest wind chill on record is for Fort Wayne. Coincidentally enough, it was 40 years ago tomorrow with a wind chill of -51F!!!! That was also the day Fort Wayne recorded its coldest daily maximum temperature of -11F. Notice how all the records happen within the same period on the calendar.
You may think it’s cold this morning (and you are certainly correct), but exactly 40 years ago today Fort Wayne and South Bend were experiencing the coldest wind chills on record! At Fort Wayne and South Bend, a wind chill of -50° was recorded on the morning of January 20, 1985!#windchill#arcticblast
After tracking this stat for over two months, we can confirm it is official! 2025 was the driest year ever in Fort...
After tracking this stat for over two months, we can confirm it is official! 2025 was the driest year ever in Fort Wayne, IN! Records began in 1897. Fort Wayne only had about 60% of their average annual rainfall this year with a total of 24.31”. The previous driest year on record was 1962.
FORT WAYNE ANNUAL RECAP: 2025 was a warm year for Fort Wayne. It was also the driest year on record since records began...
FORT WAYNE ANNUAL RECAP: 2025 was a warm year for Fort Wayne. It was also the driest year on record since records began in 1897. Read more in the annual climate summary here: https://mesonet.agron.iastate.edu/wx/afos/p.php...
Fort Wayne, IN broke or tied 11 daily records in 2025. For temperatures, this includes 2 high temperature, 1 warm low,...
Fort Wayne, IN broke or tied 11 daily records in 2025. For temperatures, this includes 2 high temperature, 1 warm low, and 6 lows. For precipitation, this includes 1 rainfall and 1 snowfall record.
Some interesting things to note:
- 2025 was the driest year on record in Fort Wayne so it is unsurprising that there are so few new snow/precip records
- Almost all of the new records in Fort Wayne happened in the latter half of the calendar year
- The daily precip (rain) record set on April 2nd was the only day to have over an inch of rain measured in Fort Wayne in 2025!
Other Weather
Cleaning the streets after a New York blizzard in 1899